Locations Push-V (1), Feof (2), Lis (3), and Bort (4)
At the initial research stage, we studied the first four locations Push-V, Feof, Lis, and Bort of the Kyiv agglomeration of S. commune. The principal component analysis by synthesized amplicons proved the effectiveness of the set of SSR DNA markers, which is reflected in the number of identified components and their contribution to the total diversity (Supplementary Fig. S1). PERMDISP showed the homogeneity of the subpopulations’ variance and the possibility of further correct analysis.
If we take into account the samples’ belonging to a specific location without their geographical coordinates, we observe a clear grouping with a significant increase in the contribution of the first (52.7%) and second (30.2%) components (Fig. 2A). The general location of the formed groups of experimental samples in the principal component space coincides with the location of the fungus populations in natural conditions (Fig. 2B). The Dnipro River is clearly superimposed on the first component’s axis, indicating the importance of the waterway in the distribution of the fungal genetic material.
Intergroup comparison of local-scale populations 1–4 S. commune samples by PCA (A), and their geographic location (B). ©mapz.com—Map Data: OpenStreetMap ODbL (https://www.mapz.com).
A short distance on a regional scale usually guarantees a close genetic relationship. With an increase in the population’s number and the presence of limiting factors, this relationship will decrease somewhat due to the accumulation of certain genotypes. The value of similarity, at which a single network of experimental samples is formed, reflects their genetic relatedness and is specific to each comparison sample. For the experimental local populations 1–4 of the fungus S. commune, a single network of relationships is formed at a similarity value of 34% (Supplementary Fig. S2). A small number of connections for some samples is evidence of their certain genetic distance within the comparison group. An increase in the percentage of similarity eventually leads to the exclusion of such samples from the general network, such as sample Sc-77, with a similarity value of 35%.
Increasing the similarity value to 45% (Fig. 3A) allows us to identify the group of the most genetically distant samples, namely Sc-120, Sc-121 of location 3 (Lis) and Sc-77, Sc-99, Sc-100 of location 4 (Bort). As an example, these samples of population 4 are located along the edge of the location (Fig. 3B), which may indicate their origin from neighboring (more eastern) populations. Similarly, for each local population, samples of “external” origin can be recorded.
The local population 2 (Feof) of S. commune remains the most homogeneous, which we believe is due to the topography of the area (Fig. 4). It is located within a ravine with significant elevation differences over its short length (∼ 2 km). The high hills on three sides reduce the possibility of other genetic variants entering from the outside and make it difficult for the local gene pool to spread. Such a natural trap slows down migration processes within the location and can act as a depository for certain genetic variations. The only exit from this ravine is oriented towards location 3 (Lis), which adds to the validity of the fact of their high affinity (Fig. 2A) and confirms our assumption.
The appearance of location 2 (Feof) (A), and its topography (B). ©mapz.com—Map Data: OpenStreetMap ODbL (https://www.mapz.com). The map was created using Golden Software Surfer 20 (https://www.goldensoftware.com).
Drift and gene flow influence the evolutionary development of a population. Over time, the population’s genetic composition changes, with some genotypes disappearing and others becoming more prevalent. We introduced the use of the centers of genetic alterations (CGA) samples, which maximally represent the population’s genetic diversity. An increase in the similarity value to 55% allows us to identify the CGA samples in each of the populations (Fig. 5). Such centers are the samples that, with an increase in the percentage of similarity, retain the greatest number of genetic relationships with other samples of the experimental sample. For local population 1 (Push-V), this is strain Sc-141, for 2 (Feof)—Sc-142, for 3 (Lis) —Sc-122, and for 4 (Bort)—Sc-135.
The combination of the four populations is maintained up to a similarity value of 63% (Supplementary Fig. S3), with a higher affinity inherent in the samples of location 2 (Feof). Increasing the value to 64% leads to the complete separation of population 4 (Bort).
The Mantel’s test allowed us to establish a moderate positive correlation (R = 0.2836, p = 0.0003) between the geographical location of the samples and their genetic variables within populations 1–4 of the Kyiv agglomeration. Although the R values are not high, given the fact that we are talking about locations of the cosmopolitan fungus that are located at small distances, this indicator is substantial. It indicates the existence of obstacles to the free spread of the fungus’ genetic material. These limiting environmental factors will also affect other fungal species with a similar lifestyle cycle.
Locations Push-V (1), Feof (2), Lis (3), Bort (4) and L_Ber (5)
The inclusion of samples from population 5 (L_Ber) in the general analysis did not affect their distribution in the principal component space (Supplementary Fig. S4). As before, the entire sample of fungi forms a single space with a large number of components.
When grouping the samples by their affiliation to a particular group, we observe that location 5 (L_Ber) has a high similarity to locations 2 and 3 (Fig. 6A) by the first component (44.2%), although their position is diametrically opposite. In our opinion, the first component reflects the evolutionary direction of the genetic profile of populations 1–5. Despite the considerable geographical distance (18–20 km) between populations 5 and 2, 3 (within the study locations), their genetic relatedness, in our opinion, is primarily due to the Dnipro River. On the contrary, the geographical proximity (12 km) of locations 5 (L_ber) and 1 (Push-V) is the opposite of their genetic relatedness according to the first component. The distribution of S. commune fungi in the space of the second (23.8%) and third (20.9%) components corresponds to the geographical map of the samples’ origin (Fig. 6B). The Dnipro River channel clearly overlaps with the axis of the second component and shows, that the direction of the current has a significant impact on the distribution of the fungal genetic material, and in particular, samples of population 5 (L_ber).
The third component, according to our assumption, is significantly influenced by such environmental factors as the left and right banks of the Dnipro River and the associated geographical elevations. It is known that the right bank of the Dnipro River is the edge of the Kyiv plateau, which stretches from the northwestern part of Kyiv to Kaniv in Cherkasy region and is accompanied by sharp elevation changes (Fig. 7A).
The topographic map of Kyiv agglomeration (A). The canonical correspondence analysis (B) between the S. commune samples location and environmental variables (riverside—left, right bank of the Dnipro River; elev—geographical altitude). www.openstreetmap.org, OpenStreetMap.
To verify our assumption, we performed a canonical correspondence analysis to establish the relationship between the locations of the research samples and the environmental factors (Fig. 7B). The results fully confirmed (Axis 1 p = 0.004) that the factors of the left and right banks of the Dnipro River and their altitudes exert pressure on the direction of distribution of S. commune samples within the Kyiv agglomeration. Moreover, the influence of the bank factor is more pronounced than the related altitudes factor.
The single network formation of S. commune samples of populations 1–5 occurs, as in the previous case, up to a similarity value of 34%. Increasing the value to 50% leads to a similar separation of samples of locations 3 (Sc-120, Sc-121) and 4 (Sc-77, Sc-99, Sc-100), indicating the absence of close genetic relationships of these cultures with fungi of population 5 (L_ber) (Supplementary Fig. S5) In local population 5, Sc-160 is the first sample to be isolated, and Sc-164 is the center of genetic alteration.
Complete isolation of samples of local population 5 occurs at a similarity of 63%, which is comparable to the previous data for populations 1–4 (Supplementary Fig. S6).
Mantel’s test for S. commune populations 1–5 revealed a positive significant correlation (R = 0.2238; p = 0.0007) between the geographical coordinates of fungus samples and their genetic component. A slight decrease in the index compared to the previous value (populations 1–4) is associated with population 5 (L-ber), which showed its genetic similarity to populations 2 and 3, although it was at a sufficient distance.
Locations Desen (6), i_Dolob (7) and i_Venec (8)
Taking into account the unique position of locations 6–8, they were included in a separate stage. The location 6 (Desen) covers the shoreline of one of the Dnipro River tributaries, while locations 7 (i_Dolob) and 8 (i_Venec) are island-like and located downstream. For an objective comparison, the nearest population 5 (L_ber) of the studied ones was additionally included. The general analysis of S. commune samples demonstrates their uniform distribution in the principal components space. Grouping samples by population (without reference to geographical coordinates) leads to a certain cohesion in the component space (Supplementary Fig. S7).
According to the first component (42.1%), location 5 (L_ber) and island 7 (i_Dolob), 8 (i_Venec) differ significantly. The second component (33.7%) clearly distinguishes population 6 (Desen). The third component (24.2%) is the key to the isolation of the island population 8 (i_Venec) (Supplementary Fig. S7B), which is the last one downstream, and its right bank is in direct contact with the main channel of the Dnipro River, unlike the others (Fig. 1).
As for the formation of a single common network of experimental samples, it is preserved up to the cutoff of 35% (Supplementary Fig. S8). The first sample to be disconnected from the network is Sc-160 (population 5 (L_Ber)). This sample had a similar property when analyzing the network ofpopulations 1–5. If we take into account only locations 6–8, which have direct access to waterways, the similarity values for the formation of a single network are higher (38%), indicating their greater genetic relatedness.
With a similarity value of 47%, we can clearly distinguish the samples that are the CGA, namely, Sc-208 for location 5 (L_Ber); Sc-178–6 (Desen); Sc-232–7 (i_Dolob); Sc-225–8 (i_Venec) (Supplementary Fig. S9). It should be noted that the sample that serves as the CGA may vary depending on the study sample. For example, in the analysis of populations 1–5, the sample Sc-164 was the CGA for location 5 (L_Ber), and in the analysis of populations 5–8, the CGA was Sc-208. By analyzing the stages of formation of the general network, it is possible to determine their probable ancestors for most samples and to study the movement of descendants in space.
To establish the relationship between the coastal (6) and island (7, 8) populations, we determined the cutoff percentages to form a comprehensive network (Table 2).
It was found that in general, the complex of populations 6–8 has a high level of similarity (38%), which is also preserved for populations 6 and 7. Downstream, the similarity value decreases to 36%, which is associated with the arrival of new genetic variations. The largest difference of 7% is observed between the outermost populations 6 and 8, although the distance between them is only 4 km. For comparison, the cutoff value between populations 6 (Desen) and 1 (Push_V) is 36%, although the distance between them is 12 km. Such a sharp drop in the value between locations 6 and 8 is probably due to the fact that we mentioned earlier, namely that the right bank of island population 8 is in direct contact with the Dnipro River. Due to the Dnipro River, new genetic variations are introduced that cannot reach other locations. We can see a practical reflection of this in the 3D scatter plot of S. commune samples by the third component (Supplementary Fig. S7B).
Analysis of eight sites of S. commune fungus
Finally, the analysis of the eight populations of the Kyiv agglomeration, taking into account the facts, allowed us to conduct a more detailed overall assessment. The distribution of the samples in the principal component space has hints of a certain grouping (Supplementary Fig. S10), which may indicate the likely direction of genetic transformation of the study group. The contribution values of the first thirty principal components varied from 6.57 to 1.12%.
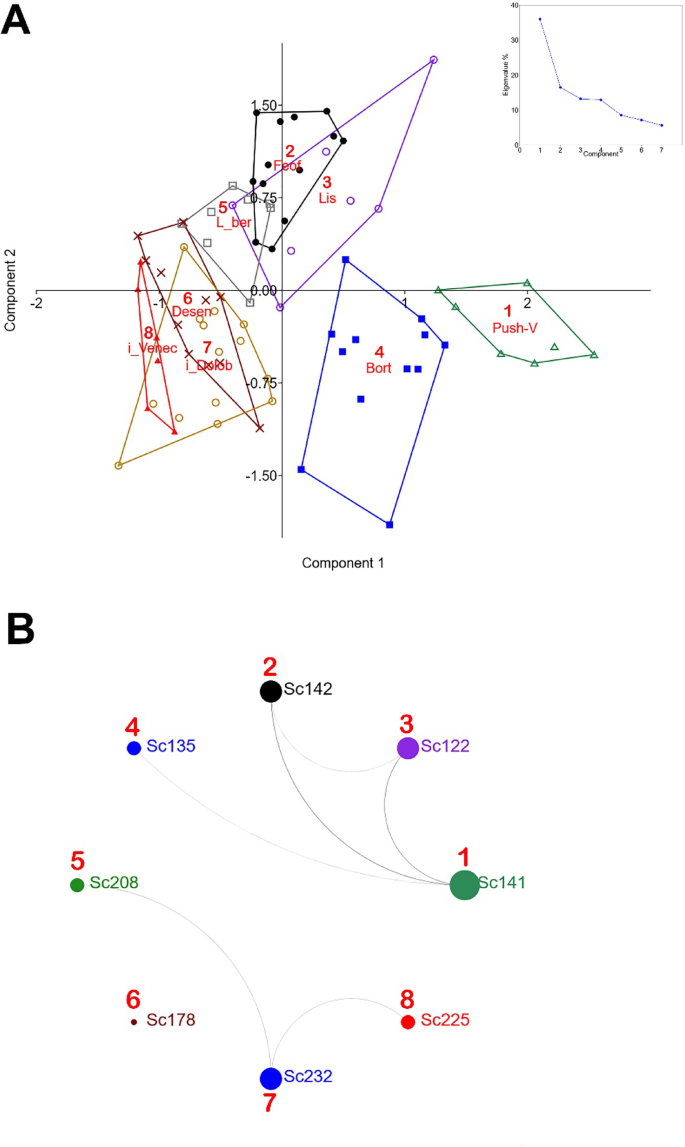
The belonging of fungal samples to certain populations leads to their grouping in the spatial (Fig. 8A).
According to the first component (36%), population 1 (Push-V) differs most from populations 6–8, although they are the closest in terms of distance. Taking into account the previous stages of the study, we are confident that this controversial fact is due to the flow of large waterways (the Dnipro River and its tributaries), which are a powerful migration factor for new genetic variations. The central space in the first component is occupied by populations 2 (Feof) and 3 (Lis). In general, the larger the sample of populations, the more difficult it is to interpret the results, especially at small distances. In addition, the variability of environmental factors and their strength also exert pressure on the spread of the fungus. As a result, with a large population, there is a certain averaging of the impact of environmental factors.
Mantel’s test showed a moderate positive correlation (R = 0.2352; p = 0.0001) between geographic coordinates and the genetic component. There was a certain averaging of the correlation coefficient data. When analyzing populations 1–4, the coefficient was 0.2836, for 1–5 it decreased to 0.2238, and finally for all populations it was 0.2352.
The formed unified network among the experimental S. commune samples from locations 1–8 of the Kyiv agglomeration is preserved up to a similarity value of 34%. To understand the degree of heterogeneity of each of the populations and in general, we calculated the edge cutoff values at which the network is formed (Table 3).
The most genetically stable were locations 7 (37%), 1 (36%) and 2 (31%). The lowest rate of 26% was shown by island location 8, which indicates more intensive immigration processes of genetic material. The maximum rate of pairwise comparison of populations of 44% indicates the highest genetic similarity between populations 2 (Feof) and 7 (i_Dolob). This may be evidence of similar temporal dynamics of transformation of these populations. In parallel, we observe a significant increase in the similarity value to 37% for locations 8 (i_Venec)—2 (Feof) and 8 (i_Venec)—3 (Lis). In the pairs of populations 1 (Push-V)—4 (Bort) and 5 (L_ber)—6 (Desen), the percentage of similarity remained stable, indicating a stable level of heterogeneity of these complexes.
The established relationships of kinship between the experimental samples of S. commune allow us to make some assumptions. Since it is very difficult to find direct descendants in a natural population, we find ancestral lines for certain samples, which allows us to determine the historical path of their “journey”. Thus, sample Sc-225 (population 8) is one of the descendants of samples Sc-229 and Sc-233 (population 7); Sc-230 (population 8) is a descendant of Sc-238 (population 7) and Sc-208 (population 5) (Supplementary Fig. S11). The findings indicate a predominant movement of fungal genetic material from north to south.
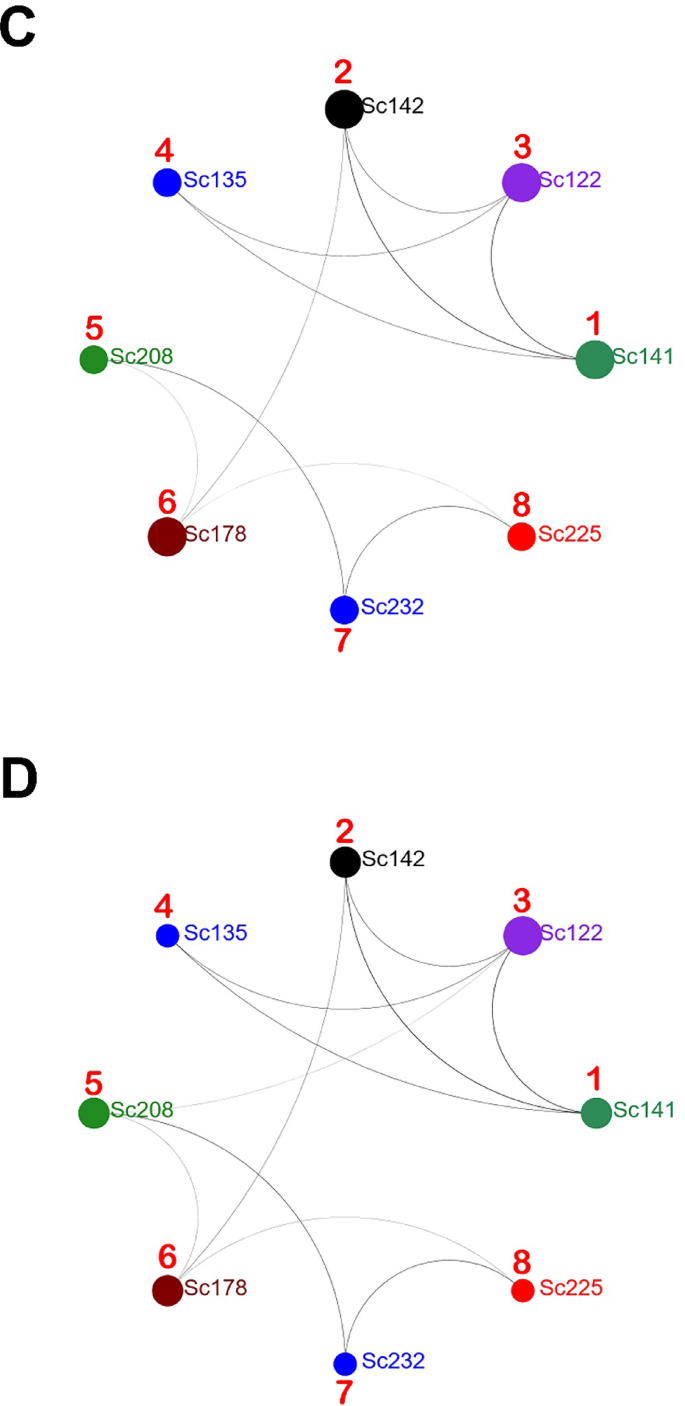
To reduce the influence of newly introduced genetic variations and to establish the evolutionary relationship between locations, it was proposed to compare only samples that are the CGA of each population. These are: for population 1—Sc-141, 2—Sc-142, 3—Sc-122, 4—Sc-135, 5—Sc-208, 6—Sc-178, 7—Sc232, 8—Sc-225. The identified relationships indicate a possible evolutionary direction of development of the Kyiv agglomeration population as a whole. With an edge cutoff value of 40%, the sample Sc-141 of location 1 (Push-V) has the largest number of genetic relationships with samples of other locations (Fig. 8B). This allows us to reasonably consider the Sc-141 sample as belonging to the primary parental lineage among the samples of populations 1–4. Reducing the edge cutoff value to 31% leads to a clear separation of two groups, namely 1–4 and 5–8 (Fig. 8C). It should be noted that the group of samples of populations 1–4 has much closer genetic relationships than populations 5–8, which may indicate either a longer time of their overall evolutionary development or, most likely, a lower dynamics of immigration processes within the group. The increased number of ties within the groups indicates a certain isolation from each other. The groups are connected through cultures Sc-142 (population 2) and Sc-178 (population 6). The dynamics of linkage formation within groups 5–8 allow us to distinguish the sample Sc-208 (population 5) as the ancestral form. Reducing the edge cutoff value to 29% leads to the appearance of another intergroup link between cultures Sc-122 (population 3) and Sc-208 (population 5) (Fig. 8D). The formed links connect populations that are diametrically opposed, and the Dnipro River in both cases can act as an active transporter of genetic material. Phylogenetic tree construction using CGA samples of the fungus validated the previous data. Samples Sc-141 and Sc-208 initiate the formation of two branches (Fig. S12).
Therefore, based on the use of CGA samples, it can be argued that the formation of the population structure of S. commune in the Kyiv agglomeration was significantly influenced by samples Sc-141 and Sc-208. Taking into account their independent origin, the movement of descendants occurred from north to south, and the Dnipro River is an active component in the formation of the genetic profile of the population.


