
The methodology for producing the dataset consisted of four main steps with several sub-steps (Fig. 1): (1) study design; (2) in situ deployment, maintenance, and data retrieval; (3) data management, analysis, and wrangling; and (4) technical validation, post-processing, and production of the final dataset and package. These sub-steps are detailed in the following sub-sections.

The methodology for producing the bird species occurrence dataset.
Study design
Survey timing and site selection (temporal and spatial sampling)
We collected bird species occurrence data during the 2024 breeding season, when bird vocal activity is at its peak23. Specifically, the data were collected from the 21st of April to the 16th of June 2024 across 30 sites in Gothenburg, Sweden (Fig. 2). Of these, 19 sites represented three distinct types of dense urban forms: compact low-rise buildings, compact mid-rise buildings, and dense mid-rise buildings (see Berghauser Pont et al.24,25 for a detailed description of these types). Acoustic recorders were placed at 6–7 representative sites of each of the three dense urban form types, attached to trees in publicly accessible urban green spaces between buildings or to trees along streets. The other 11 sites were designated as reference sites, i.e., where bird vocalization activity is expected to be higher, such as big urban parks, woodlands, and more spacious urban form types with abundance of vegetation.

The 30 study sites across central Gothenburg, Sweden.
Approvals and permits
Considering that acoustic recording may raise privacy concerns, before the in situ deployment, we acquired ethical approval from Chalmers University of Technology’s Institutional Review Board on Research Ethics (Dr.nr: M2 2023-0194:6D) and conducted a Data Protection Impact Assessment (DPIA). The DPIA outlines the actions taken to minimize data protection risks. This included, for instance: automatically identifying and excluding audio files with human vocalizations; setting a recording schedule with intermittent short clips to minimize the capture of complete conversations (if any occur near the recorders); and making good-faith efforts to inform the public that recording is occurring. Furthermore, we obtained placement permits from the municipality of Gothenburg to legally deploy acoustic recorders on public land.
Hardware (acoustic recorder equipment)
The hardware used for the PAM across the 30 sites was the AudioMoth (v1.2.0)26, a low-cost (<€100), full-spectrum (up to 192 kHz) acoustic recorder with a small size (5.8 × 4.8 × 1.5 cm). It records uncompressed WAV files to a microSD card to preserve audio quality and is powered by three AA batteries. The AudioMoths were housed in waterproof injection-molded cases (IPX7) that were tested to ensure sound quality. A detailed guide on getting the necessary supplies (e.g., microSD cards, batteries, cases) and assembling and configuring an AudioMoth can be found, for example, in Rhinehart and Guzman27.
Recording configuration
Each AudioMoth was configured to record at a sampling rate of 96 kHz with a medium gain setting (i.e., a boost in amplitude applied to the audio signal). A sampling rate of at least twice the highest call frequency of interest, known as the Nyquist frequency, is required to resolve all frequency information11. Determining the optimal gain typically requires experimenting with different gain settings, depending on the field conditions28. However, in most cases, a medium gain setting is appropriate to capture quieter sounds at good quality while minimizing the risk of clipping or excessive background noise, especially in urban areas29. For privacy protection, battery life, data storage, and computational considerations, we employed a targeted “on-off” time sampling approach focused on the times of peak bird vocal activity (around the main dawn, morning, and evening chorus times). Specifically, the AudioMoths were configured to record for 1 minute every 2 minutes over a total of 12 hours per day (3 hours before sunrise to 4 hours after, and 2 hours before sunset to 3 hours after). This approach was found to capture data highly comparable to continuous recordings while avoiding an overwhelming data mountain30,31.
Pilot sampling
Prior to the large-scale deployment, we conducted smaller-scale pilots at a subset of the planned sites to test and confirm the aforementioned recording configurations, deployment conditions, and analysis methods.
In situ deployment, maintenance, and data retrieval
For each of the 30 sites, recorders were positioned horizontally at around 3 meters above the ground on tree trunks to improve sound quality and protect them from theft or vandalism (Fig. 3). Furthermore, recorders were placed away from branches and leaves as much as possible and oriented to face away from streets to reduce background noise11,16,27. In addition to the recorders, signs were placed at each site, in compliance with the DPIA, to inform the public that recording was taking place with more details about the recording times, the purpose of the study, and contact information for inquiries.

AudioMoth recorders housed in IPX7 waterproof cases and strapped to tree trunks in different study sites in Gothenburg, Sweden.
Throughout the deployment period, batteries were replaced regularly, and the audio files were retrieved from the microSD cards before they became full. Furthermore, site metadata (e.g., name, latitude, longitude, recorder unique ID, microSD card number, deployment and pickup dates and times, and notes) were recorded during the initial deployment and updated with each subsequent site visit.
Data management, analysis, and wrangling
In total, we collected 641,502 audio files, amounting to approximately 10,691 hours of recordings and around 7 TB of data. Each audio file was named with date and time information and stored in a directory structure organized by the round of data collection (a total of five rounds), site, and date.
The raw audio files were used as input for a convolutional neural network (CNN) model to identify vocalizing bird species based on 3-second clips/spectrograms, namely BirdNET19. BirdNET is a state-of-the-art CNN model that is pre-trained on 6,522 species (v1.3.1, version used) and has shown good accuracy in several studies32. The BirdNET model was run in R (v4.4.1) using the NSNSDAcoustics package (https://github.com/nationalparkservice/NSNSDAcoustics) to process the audio files, applying the default inference settings (detection sensitivity of 1.0, no segment overlap, and a minimum confidence threshold of 0.1), and using a custom species list.
Sensitivity controls how responsive BirdNET is to faint or background vocalizations, with higher values leading to more detections. Overlap determines whether each 3-second prediction segment should begin immediately after the previous segment or start earlier, allowing for a temporal overlap between segments. Recently, some studies have shown that increasing sensitivity and/or overlap values from default settings can improve BirdNET’s performance (e.g., by reducing false negatives and thereby increasing recall), particularly for short recording schemes and lower temporal aggregations (e.g., minute-, day-, or week-level)33,34,35,36. However, with longer and more frequent data collection, as in our case (i.e., recording for 1 minute every 2 minutes over 12 hours per day for two months), this may not be necessary, as bird calls potentially missed due to being cut off at segment edges are likely to recur34. Also, higher sensitivity and/or overlap settings can increase the false positive rate, which requires more extensive manual validation36. This also significantly increases processing time, which can become a major challenge when processing large amounts of audio data without much improvement in recall19,35.
The confidence score is “a unitless, numeric expression of BirdNET’s confidence in its prediction [ranging from 0 to 1]”37 (p778). A higher confidence score indicates a higher likelihood of correct classification35. The choice of a minimum confidence score threshold to filter the detections directly impacts the number of species detected, with lower confidence scores resulting in a larger number of species detected32. Therefore, selecting an appropriate minimum confidence threshold and manual validation of resulting species detections by an expert ornithologist is essential to ensure the accuracy of the results38. To identify the best minimum confidence threshold, we ran the BirdNET analysis using the default low confidence level (0.1) to obtain a complete list of detections, which could then be filtered by testing different confidence thresholds as explained in the next section.
The custom species list used was generated using all publicly available data from the Swedish Species Observation System (Artportalen; https://artportalen.se/) on bird species observed in Gothenburg, Sweden, and included 351 species. Artportalen is the main repository for Swedish species observations and is well acknowledged for its successful gathering of data from ornithologists active in Sweden39,40. Using a custom species list—either by supplying BirdNET with location and week-of-year information or by manually compiling a list—is recommended to improve performance, as it helps exclude unlikely species beforehand, reducing false positives34. The custom list was first compared to the list of species on which the BirdNET model was trained (6,522 bird and non-bird species) to identify any inconsistencies or missing species. Six bird species had scientific name synonyms, and eight local species were completely missing from BirdNET’s training data: Gulosus aristotelis, Alle alle, Glareola nordmanni, Polysticta stelleri, Anas crecca carolinensis, Falco eleonorae, Pagophila eburnea, and Branta ruficollis. However, these eight species were deemed unlikely to occur in the study sites when evaluated by an expert ecologist (O.K.). Therefore, the final species list used for analysis included 343 species. In addition to the bird species, we included in the custom species list three labels for human-produced sounds that BirdNET can detect, namely “Human vocal”, “Human non-vocal”, and “Human whistle”. These labels were included to facilitate the identification and exclusion of audio files containing human vocalizations, in compliance with the DPIA mentioned earlier.
The output of the BirdNET model is a CSV file per WAV file, containing a list of detections (rows) and corresponding attributes (columns), such as the path to the processed audio file (named with the date and time information), species’ scientific name, start and end seconds of the detection, and confidence score.
In the next step, the CSV files were merged into a database table with 4,664,290 rows (observations) and a total of 338 unique bird species detected out of the 343 in the custom species list. The dataset was then processed to extract the site, date, and time information from the file path into separate columns and to create a unique recording identifier column for easier data manipulation.
Technical validation, post-processing, and production of the final dataset
To identify an appropriate minimum confidence threshold for expert validation, we first set a high threshold of 0.85, which resulted in 206 unique bird species (out of the 338 detected at the minimum threshold of 0.1). We then lowered the threshold to 0.80, where 15 additional species were included. These 15 species had only one or two detections, all of which were found to be false positives after an expert ornithologist (L.J.) listened to the recordings, suggesting that a threshold of 0.85 is suitable for this study. However, this does not necessarily mean that the detections of the remaining 132 species with confidence scores below 0.85 are entirely false positives. Therefore, these 132 species were further scrutinized by the expert ecologist on a case-by-case basis to determine which species were likely to occur at the specific study sites. Nine species were identified as such: Emberiza schoeniclus, Carpodacus erythrinus, Podiceps cristatus, Oenanthe oenanthe, Jynx torquilla, Linaria cannabina, Luscinia luscinia, Acrocephalus schoenobaenus, and Alauda arvensis. For each of these nine species, the expert ornithologist listened to a random sample of audio files in which the species was detected (up to 50 per species where available, totaling 442 one-minute recordings). All examined detections were confirmed to be false positives. The dataset used for expert validation, therefore, includes 206 unique species with 250,472 occurrence records (at a minimum confidence of 0.85).
Following Sethi et al.41, Bick et al.42, and Fairbairn et al.34, for each of the 206 species we randomly retrieved 50 unique audio files in which that species was detected with a minimum confidence of 0.85, ensuring that no two detections of the same species selected for validation came from the same audio file. If a species was detected fewer than 50 times or there were not 50 unique audio files, all available audio files were retrieved. This resulted in a validation dataset of 5,007 one-minute audio files. The expert ornithologist then listened to each audio file and classified each associated detection as correct, incorrect, or unsure. For records classified as incorrect or unsure, the ornithologist, when confident, provided suggestions for the likely species or sound. The ornithologist-validated dataset was used to reclassify and/or remove records and to train a predictive classification model to produce the final curated dataset, as explained in more detail below.
The validation results (Fig. 4) show that 43 species achieved a classification accuracy of over 60% (with 26 species having a 100% accuracy), 17 species had an accuracy between 60% and 2%, while all the remaining 146 species were false positives.

Ornithologists’ validation of BirdNET’s classification results. The figure shows the percentage of correctly classified detections per species (with 50 validated detections, left, and <50 validated detections, right). The vertical dashed lines mark a 60% accuracy threshold. The figure style is adapted from Sethi et al.41.
Based on the validation results, we further processed the dataset (with 250,472 records) as follows. For the 5,007 “validated” records by the ornithologist, we retained those that were correctly classified, reclassified records that were incorrectly classified and the ornithologist suggested other species, and removed records that were incorrectly classified and the ornithologist could not recognize the species/sound or was unsure (Fig. 5).
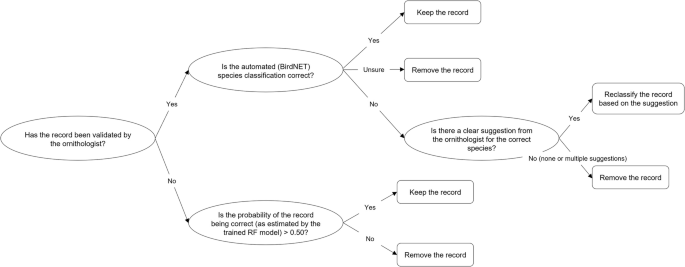
Decision tree for the data records exclusion or reclassification based on the validation results.
For the “non-validated” records, we trained a binary Random Forest (RF) probabilistic classifier based on the ornithologist-validated dataset to estimate the probability that each record was correctly classified by BirdNET. The model training and evaluation process is described in more detail below. In the final dataset, we retained only non-validated records with an estimated probability above 50% (Fig. 5). This process resulted in a curated dataset with 239,597 occurrence records of 61 species. This includes 60 species that achieved an accuracy above zero (Fig. 4), plus one species (i.e., Regulus regulus), which the ornithologist identified during validation to be the correct classification for a false positive detection of another species (i.e., Regulus ignicapilla).
The RF classifier model was implemented in R using the ranger package43 (v0.17.0). It was configured with 500 decision trees and trained on 2,496 ornithologist-validated records from the 60 species that achieved an accuracy above zero (Fig. 4). Three predictors were used: (1) species name (BirdNET classification); (2) BirdNET confidence score; and (3) whether the detection was isolated. The latter indicates whether a bird detection is not preceded or followed by another detection of the same species within a 9-second window. Isolated detections have been found to increase false positives12,44.
To evaluate the model performance and select the best-performing RF model hyperparameters—specifically the number of variables considered at each split (mtry) and the node splitting rule (splitrule)—we used repeated cross-validation (5 folds, repeated 5 times). Model performance was measured using the area under the ROC (receiver operating characteristic) curve (AUC), a threshold-invariant metric widely used for evaluating binary classifiers45. The hyperparameter configuration with the highest average AUC across all cross-validation sets was selected. The ROC curve shows the model’s performance in terms of sensitivity (true positive rate) and specificity (1 − false positive rate) across all possible probability thresholds, with AUC values closer to 1 indicating better model performance in terms of distinguishing between classes. Figure 6 shows the ROC curves from all the cross-validation sets. The best-performing RF model hyperparameter configuration (mtry = 2, splitrule = gini) resulted in an average AUC of 0.95 across all cross-validation sets. This indicates a high model’s ability to distinguish between the positive and negative classes. The best-performing hyperparameter configuration was used to train the final model on the entire training dataset (2,496 records), and the trained model was then used to estimate probabilities for the non-validated records of 60 species.
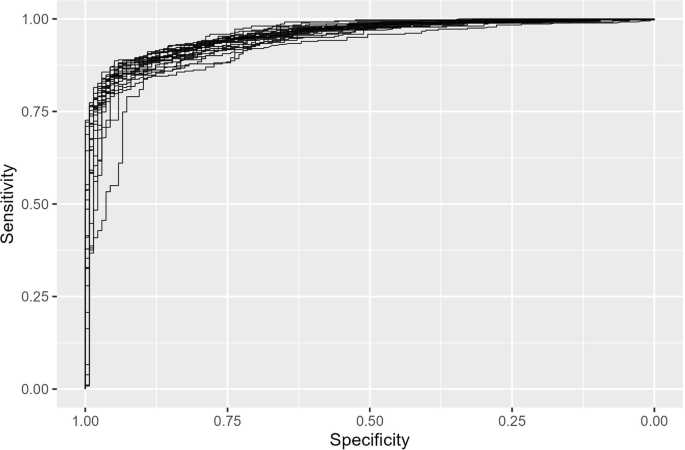
ROC curves from all 25 cross-validation sets (5 folds, repeated 5 times). The average AUC across all curves is 0.95.
In the final step, the curated dataset was further processed by renaming existing attributes and creating new ones in accordance with the Darwin Core standard46 (see next section).


