The negative impacts of warfare and prolonged human conflict on biodiversity knowledge are noncontroversial. Understanding and inferring their negative causal relationships, although intuitive and inferred in past studies, requires delving into diverse pathways through which conflict might negatively affect the understanding of biodiversity1,2. In a recent study, Hilario–Husain and colleagues (hereafter “HH”)3 utilized a spatially explicit analysis to explore relationships between human conflict and biodiversity knowledge on Mindanao Island, southern Philippines. Their findings showed that regions in Mindanao marked by heightened conflict exhibited lower observed species richness, fewer occurrence records, and reduced forest cover. Although the authors advised cautious interpretation, their narrative discusses a negative causal relationship (i.e., impact) of conflict on biodiversity knowledge and conservation. While we applaud their admirable probing of this important question, we note that several of their conclusions, although intuitive, are likely premature and may require substantial reconsideration, reanalysis, and a more nuanced interpretation.
HH3 modeled provincial observed species richness as a function of proximity and frequency of a large dataset of poorly defined, media-reported conflict events4. Our primary concern lies in the interpretation of results based on such a broadly defined conflict dataset from the United Nations Office for the Coordination of Humanitarian Affairs (UN-OCHA)4, overlooking historically, politically, and socioeconomically dependent factors that we argue contribute to the “conflict” variable in HH’s analyses. Conflicts are inherently complex phenomena that assume forms influenced by the context in which they occur1,2,5. Quantitatively analyzing these phenomena requires simplifying complexities, which should not impede a study as long as clear and consistent definitions are used. Precisely defining conflict should structure research framing, interpretation, and data selection, the lack of which draws our attention to the results and interpretations of HH’s study. We question whether the sporadic, loosely defined pool of violent incidents included in HH’s paper as “conflict” adheres to the process-based definition used in warfare ecology studies6,7 cited therein. HH’s lumping of ephemeral, context-dependent phenomena into a single, poorly defined “conflict” variable compels us to question the statistical defensibility of their conclusions on how conflicts may impact biodiversity knowledge. We discuss three general areas of concern.
First, HH’s treatment of species richness lacks clarity, though their study seems to assess knowledge shortfalls and thus focus on sampling or research efforts. Pinpointing knowledge shortfalls is essential for grasping the relationship between conflict and understanding biodiversity, but we believe it is vital to incorporate all relevant data sources when compiling existing information to evaluate such gaps comprehensively. We express significant reservations regarding HH’s exclusive reliance on the MOBIOS+ database8 for species occurrence records. Our examination of MOBIOS+ revealed numerous deficiencies, including overlooked references on Mindanao biodiversity, erroneous and outdated species records, unclear taxonomic treatments, and insufficient coverage of certain taxonomic groups. Notably, we identified around 90 dubious species records that may have influenced species richness calculations and subsequent downstream analyses (Supplementary File 1). MOBIOS+ primarily integrates data from selective literature, focusing on biotic inventory studies8, and disregarding volumes of species’ occurrence records from other relevant sources, including taxonomic and systematics publications, natural history notes, citizen science data, and vouchered specimen-associated records, curated (verified, cleaned, and mobilized as per GBIF standards) and freely served per the global consensus and Darwin Core standards. For instance, HH’s documentation of Mindanao’s herpetofauna underwhelms a recent comprehensive assessment that used curated data from multiple sources in the public domain9. Additionally, MOBIOS+ conspicuously lacks representation of major insect groups, with its source studies disproportionately focused on Lepidoptera and Odonata. Although we commend the development of a Mindanao faunal region biodiversity database, the systematic bias introduced by precariously uneven data and taxonomic representation calls into question results derived solely from MOBIOS+ and prompts us to caution against its exclusive use for landscape-scale biodiversity analysis—particularly given that other transparent, appropriately curated, and specimen-associated data sources are freely available. As data have become increasingly available and accessible10,11,12, such selective use of data falls far short of today’s standards of reproducibility and transparency, especially when addressing biodiversity knowledge shortfalls. Ensuring that all relevant data sources are considered, along with careful curation, cleaning, and filtering, reduces data biases that may confound results and interpretations12.
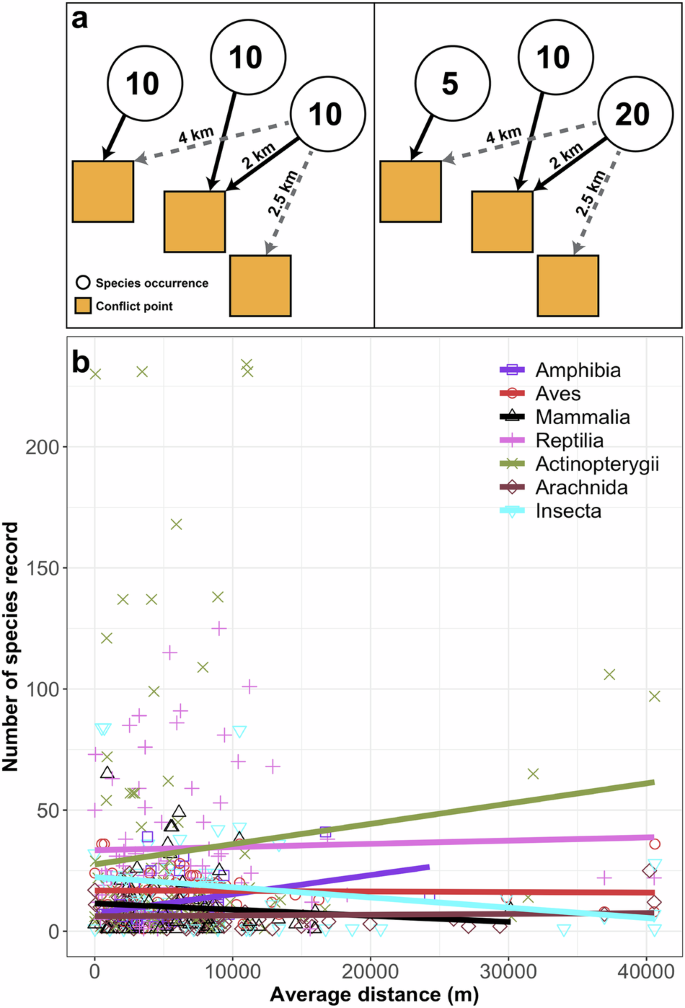
Insufficiencies in their data bring us to our second major concern: HH’s study is virtually irreproducible and untestable due to a lack of methodological details. This lack of clarity obscures the reproducible characterization of HH’s response variable “observed species richness,” pivotal to any conclusions regarding how human conflict affects biodiversity knowledge. It is unclear what constitutes a sample in their analyses, as this fundamental quantity is not explicitly defined in the methods. If the response variable, observed species richness at the provincial level, is modeled as a function of distance from conflict points, conflict frequency, and taxonomic groups, we can only assume that each species occurrence record is treated as a sample. If this is the case, we face two approaches for computing provincial species richness without condensing the distance from the conflict variable into a single value per province, which would increase the precision and reliability of statistical estimates of the model: (A) Treating each taxon-specific occurrence record independently (per point species richness), or (B) assigning uniform species richness values to all taxon-specific occurrence records within a province (provincial species richness of each taxonomic group) (Fig. 1a). These crucial details are not included in HH’s narrative, rendering their results irreproducible and virtually impossible to interpret.
a Two potential approaches for calculating provincial species richness without reducing the distance from conflict variable into a single value per province: treating each taxon-specific occurrence record independently (per point species richness, right panel) or assigning uniform species counts to all taxon-specific occurrence records within a province (provincial species richness of each taxonomic group, left panel). Solid arrow shows the nearest conflict point to species occurrence, and light dashed arrows show other nearby conflict points. b Relationship between species records and the average distance from conflict points (m) per taxonomic group.
Third, HH’s method for measuring distance (m) from species occurrence points to the nearest conflict points lacks clarity and critical details. The choice of coordinate reference system, the number of nearest neighbors considered, and maximum distance thresholds in the QGIS plugin “Join Attributes by Nearest” significantly influence the resulting values. Figure 4b in their paper shows an average maximum distance of conflict points from species occurrence points as only 120,000 m. However, replicating their method yielded an average distance of 7000 m, with a maximum of 40,000 m (Fig. 1b). This significant disparity suggests that HH may have implemented a maximum distance threshold. Without specifying the settings used in QGIS, readers cannot replicate HH’s calculations accurately. Beyond the questions related to how HH calculated this variable, we have deep concerns about the raw input coordinate data—which if used indiscriminately, could have introduced bias into HH’s analyses. Coordinates from the UN-OCHA conflict database, according to their metadata, have varying spatial precision. Even at the highest precision (‘Geo-precision’ code 1), the exact coordinates of reported conflict events are not guaranteed, with the same coordinates potentially used for different events within the same town. The imprecision worsens with ‘Geo-precision’ codes 2 and 3, representing broader areas with less accurate georeferencing. This lack of precise coordinate data can impact the reliability of calculating the distance between conflict and species occurrence points. The absence of clear information on how raw data were treated, curated, and filtered makes HH’s model challenging to validate, reproduce, and interpret—and yet, interpret they did.
We attempted to emulate HH’s analyses by modeling provincial species richness as a function of provincial conflict frequency, distance from conflict points (m), and taxonomic group (Supplementary File 2). Following a stepwise model selection process, we confirmed the inclusion of these variables in the best model (AIC = 3611.7, Residual deviance = 3019.9, df = 103). Our analyses revealed negative relationships between observed species richness and both provincial conflict frequency (−0.0485 ± 0.0074 se, z = −6.548, p < 0.01) and distance from conflict points (−0.0430 ± 0.0126 se, z = −3.418, p < 0.01), indicating fewer species records in areas with higher conflict frequency and greater distance from conflict points. However, our inferred decline in observed species richness with increasing distance from conflict is opposite from HH’s findings. Figure 4 in HH’s paper shows that observed species richness for certain taxonomic groups, particularly birds and insects, increases with distance from conflict points. However, our visualization (Fig. 1b) suggests a different pattern, indicating that observed species richness for birds and insects decreases with increasing distance from conflict points, also highlighting differential responses among taxonomic groups to conflict. Thus, when treating taxonomic groups as a random effect in the model to account for group-level differences, we revealed a marked difference in explained variance between models with fixed effects only (marginal R2 = 0.0174) and both random and fixed effects (conditional R2 = 0.9518). This outcome indicates that, although conflict-related variables exhibit statistical significance, their contribution to explaining variation in observed species richness is negligible (~2%). Our results hold when considering species occurrence as individual samples, except distance from conflict variable is no longer included in the best model (per point species richness; Supplementary File 2).
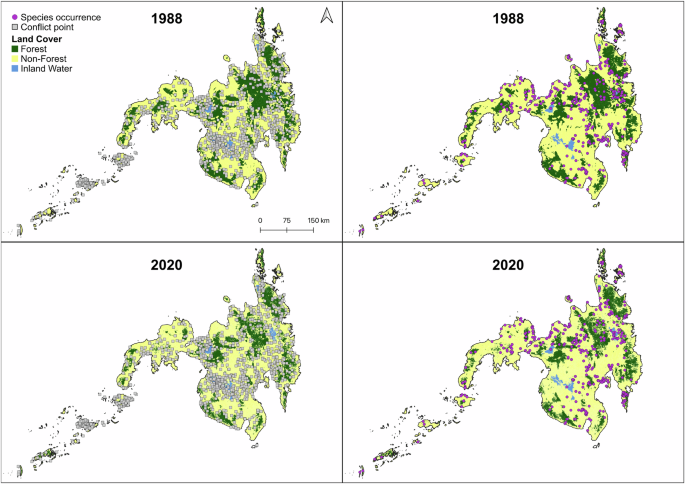
The recovered relationships between observed species richness and distance from conflict point across taxonomic groups persisted even after addressing sampling bias by removing duplicate data points and thinning both species occurrence and conflict records (Supplementary File 3). With the thinned dataset showing no spatial autocorrelation (Moran’s I = −0.0014, p = 0.1042), new linear model results revealed that conflict frequency remained significant (−0.1127 ± 0.441 se, t = −2.555, p = 0.0110), whereas distance from conflict points was no longer statistically significant (−0.0037 ± 0.0501 se, t = −0.074, p = 0.9408). Moreover, including vegetation predictors (tree density, tree cover, canopy height), which were negatively correlated with the number of fatalities in HH’s study, showed insufficient evidence of an effect on biodiversity records (p > 0.1000). Although conflict is more common in open habitats, this pattern does not inherently bias biodiversity knowledge in these regions (Fig. 2). In fact, raw biodiversity data points exhibit higher frequencies in open habitats (e.g., shrubs, cultivated areas, grasslands, open forests) than in closed habitats (e.g., closed forests). The lower observed species richness in open habitats compared to closed forests appears to be more attributable to habitat characteristics than to conflict-related bias (Supplementary File 3). These findings challenge HH’s argument that conflict negatively biases biodiversity knowledge. Simply correlating conflict points with habitats risks confounding such interpretations.
Forest cover on Mindanao in 1988 and 2020, overlaid with conflict points and species occurrence records, shows predominant conflict occurrence in open areas rather than closed forested areas. Land cover data for 1988: Swedish Space Corporation13 and 2020: Philippine National Mapping and Resource Information Authority, retrieved from geoportal PH (https://www.geoportal.gov.ph/).
In summary, although we commend HH for posing an important question, we believe that their patchy and error-laden data, vague definitions of key variables, and methodology lacking rigor and reproducibility fall short of substantiating their interpretations and conclusions. Despite claiming that their research sheds light on the connection between conflict and biodiversity knowledge gaps in Mindanao, we argue that their analyses fall short by relying on insufficient sources of biodiversity data and oversimplifying the complex nature of Mindanao conflict. Therefore, it would have been highly advisable for HH to have contextualized their results and crucially important for them to have refrained from using causal language in their discussion to avoid misleading readers from the scientific community, conservation circles, and general public. These deficiencies compromise the internal validity of HH’s study and lead us to advise against applying their non-contextual and haphazard recommended conservation strategies in decision-making. In biodiversity hotspots like the Philippines, where conflict may profoundly impact ecosystems6, empirical investigations into this relationship hold promise. Although the work of Hilario–Husain and colleagues3 is admirably thought-provoking, realizing this potential will require a transparent, statistically robust, methodologically meticulous, and truly multidisciplinary approach.

