Sequence statistics and fish composition
In this study, a total of 4,594,782 high-quality sequences (2,457,586 in April and 2,137,196 in September) were obtained after quality filtering and removal of chimeric reads, with an average of 124,183 sequences per sample. After bioinformatics filtering analysis, 166 fish species were detected in the eDNA survey conducted in the main stream of Kashi River and distributed across 111 genera, 44 families and 21 orders in two-season. Statistical analysis of eDNA data collected from 16 sampling stations in April identified 77 fish species. In September, eDNA analysis from 21 stations revealed a significantly greater taxonomic diversity, identifying 137 fish species. The results of seasonal snapshot monitoring showed noticeable differences in fish communities, with only 48 fish species consistently detected across both seasons. The survey situation of fish in each season was listed in Supplementary Table S1. We analyzed the monitoring results of two-season separately.
77 fish species belonging to 55 genera, 23 families, and 11 orders were detected in April, among the order levels, Cypriniformes, Gobiiformes, Siluriformes had the largest amount of eDNA monitoring; Among the family levels, Cyprinidae, Nemacheilidae, Xenocyprididae, Gobiidae, Acheilognathidae had the largest amount. Among the genera levels, Triplophysa, Rhinogobius, Acheilognathus had the largest amount (Table S1).
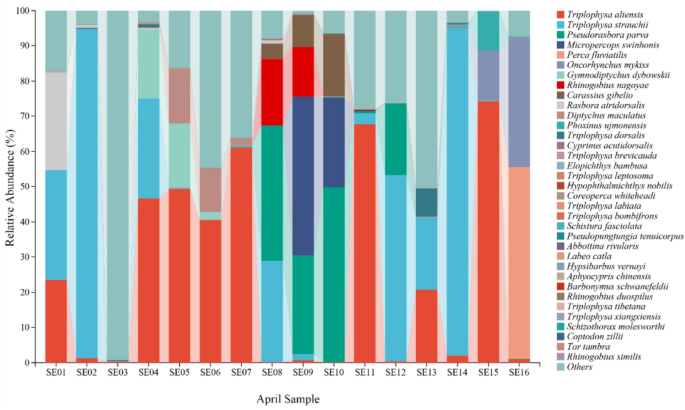
Figure 2 illustrated the species-level taxonomic composition and relative abundance of fish detected in different samples. Species are ordered by abundance, highlighting community structure variations among stations (Fig. 2). Variations in species composition among sites reflect spatial heterogeneity, and some samples show limited species annotation due to low eDNA concentrations or detection limitations. The fish species with high relative abundance detected in the April survey were Triplophysa aliensis, Triplophysa strauchii, Pseudorasbora parva, Micropercops swinhonis, Perca fluviatilis, Oncorhynchus mykiss, Gymnodiptychus dybowskii, Rhinogobius nagoyae, Carassius gibelio, Rasbora atridorsalis. (Fig. 2).
Species-level composition of fish communities based on the April eDNA survey. The horizontal axis represents the sample names. The vertical axis represents the relative abundance (%) at the species level. The right side illustrates the species-level taxonomic composition detected by eDNA monitoring in April, represented in the bar chart with different colors.
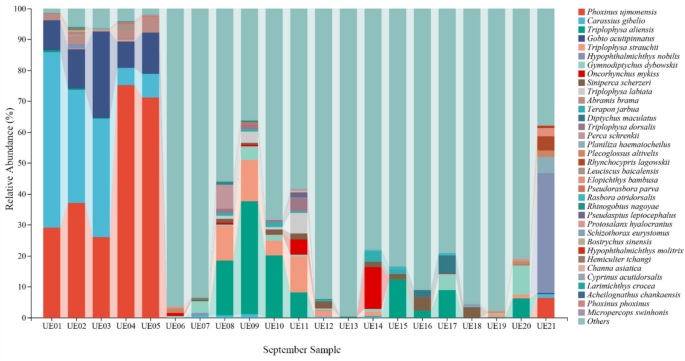
Then 137 species belonging to 101 genera, 43 families, and 21 orders were detected in September. Among the order levels, Cypriniformes, Gobiiformes, Perciformes had the largest amount of eDNA monitoring. Among the family levels, Leuciscidae, Xenocyprididae, Cyprinidae, Gobionidae, Nemacheilidae had the largest amount. Among the genera levels, Acheilognathus, Gobio, Phoxinus had the largest amount (Table S1). The fish species with high relative abundance detected in the September survey were Phoxinus ujmonensis, Carassius gibelio, Triplophysa aliensis, Gobio acutipinnatus, Triplophysa strauchii, Hypophthalmichthys nobilis, Gymnodiptychus dybowskii, Oncorhynchus mykiss, Siniperca scherzeri, Triplophysa labiate (Fig. 3).
Species-level composition of fish communities based on the April eDNA survey. The horizontal axis represents the September samples. The vertical axis represents the relative abundance (%) at the species level. The right side illustrates the species-level taxonomic composition detected by eDNA monitoring in September, represented in the bar chart with different colors.
Then, the freshwater fish statistics of the two-season were shown in Table 1. In general, the fish diversity of the Kashi River basin is very rich, with results showing a total of 153 freshwater fish species monitored over the two-season, and the fish composition of the two-season is significantly different. 73 freshwater fish were detected in April and 124 in September, among which 44 species of freshwater fish were detected in the two-season (Table 1).
“ + ” indicates species detected in the corresponding season; “✓” indicates species detected in both seasons; blank cells indicate absence. Species are listed in alphabetical order based on their scientific names.
Fish distribution in Kashi River
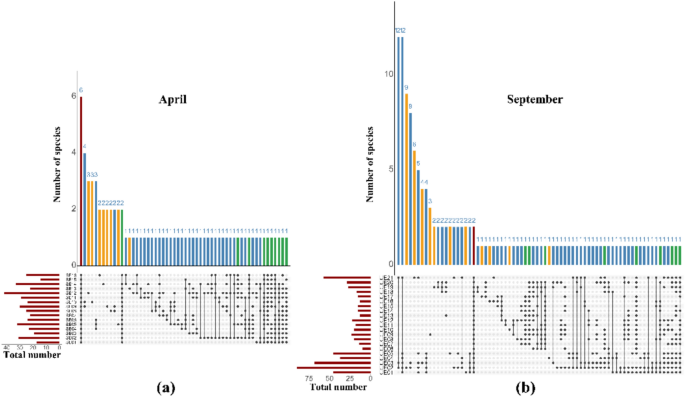
Figure 4 presents UpSet plots showing the overlap and distribution of fish species across sampling stations in April (a) and September (b), based on OTUs detected through eDNA analysis. As shown in the Fig. 4a, only 7.79% (6/77) of the fish species overlapped in all combinations of the April surveys as indicated by the red bars, with no significant difference fish numbers observed among sampling locations. Additionally, 14.29% (11/77) of fish species were detected at more than 50% of the stations. Station SE12 recorded the highest number of fish species, while station SE01 had the lowest. Notably, 22.08% (17/77) of the fish species identified in April were unique to that survey. The majority of unique OTUs were detected at stations SE10 and SE12, followed by SE16, SE14, SE09, SE08, and SE13 (Fig. 4a).
UpSet plots showing the overlap of fish species across stations in (a) April and (b) September. Red bars represent species shared across all stations; yellow bars indicate species unique to a single station; green bars show species detected at more than half of the stations (> 50%). The horizontal bars display the total number of species observed at each station.
In September, the OTU profiles sampling locations were highly variable, with only 1.46% (2/137) of fish species common to all sampling combinations (Fig. 4b). A larger proportion of species (6.57%, 9/137) were shared across more than 50% of stations, while 23.36% (32/137) were unique to only one station. Most unique OTUs in September were found at station UE21, followed by stations UE19, UE09, and UE02. Station UE02 recorded the highest fish species richness, while station UE06 detected the fewest species (Fig. 4b). These results highlighted differences in community composition and spatial distribution patterns.
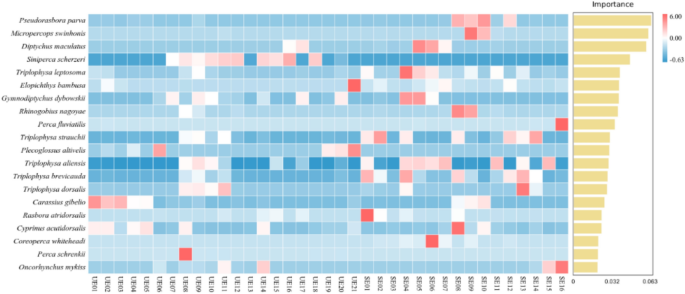
The 20 most abundant fish species detected across the two-season were presented in Fig. 5. Species are ranked from top to bottom in descending order of significance, which from 6.00 to −0.63. A few species showed negative permutation importance values, indicating that their presence may introduce noise or have little relevance to the classification task (Fig. 5). These top-ranking species can be considered as key indicators of group differences between the two-season, highlighting their pivotal role in shaping the seasonal fish community composition of the Kashi River in the Ili River. The 20 most abundant species identified across the two surveys included Pseudorasbora parva, Micropercops swinhonis, Diptychus maculatus, Siniperca scherzeri, Triplophysa leptosoma, Elopichthys bambusa, Gymnodiptychus dybowskii, Rhinogobius nagoyaePerca fluviatilis, Triplophysa strauchii, Plecoglossus altivelis, Triplophysa aliensis, Triplophysa brevicauda, Triplophysa dorsalis, Carassius gibelio, Rasbora atridorsalis, Cyprinus acutidorsalis, Coreoperca whiteheadi, Perca schrenkii, Oncorhynchus mykiss (Fig. 5).
Fish diversity and seasonal variation
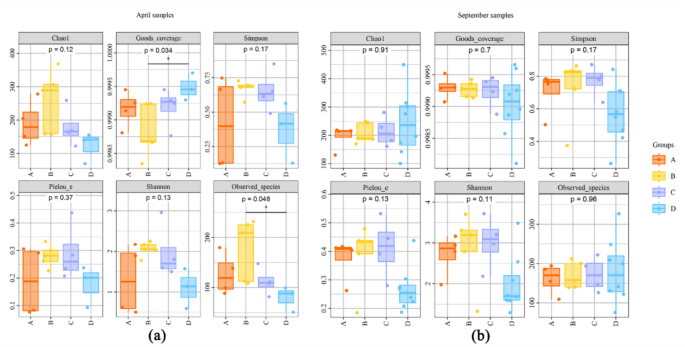
Ultimately, samples from two-season were grouped into four groups (A to B) for alpha diversity analysis, based on their longitudinal positions along the river from upstream to downstream (Fig. 1). Although the specific sample IDs within each group differed between seasons due to variations in sampling order, the groups were consistently presented in upstream-to-downstream order to ensure comparability. Figure 6 presented boxplots of alpha diversity indices (Observed species, Chao1, Shannon, and Simpson) across different sample groups. In each panel, the horizontal coordinate is the group label, and the vertical coordinate is the value of the corresponding alpha diversity index. The numbers under the diversity index label are the P-values of the Kruskal–Wallis test. Overall, no significant differences were observed among the groups in terms of species richness and diversity, indicating comparable levels of α diversity across regions.
In April, Group B exhibited notably higher Observed species and Chao1 indices compared to the other groups, suggesting a potentially higher species richness in this section. Some of the differences among groups were statistically significant (Kruskal–Wallis test, p < 0.05), indicating that spatial variation along the river may have a significant influence on fish diversity patterns (Fig. 6a). Additionally, the results showed that no significant difference in Shannon diversity was detected in September between the upstream and downstream regions (P > 0.05), suggesting that overall community evenness remained stable across stations (Fig. 6b).
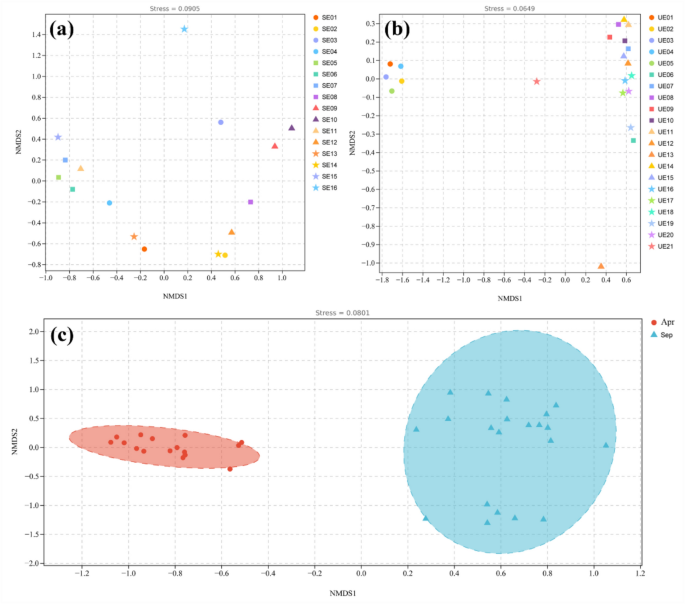
The difference of fish composition among samples was demonstrated by NMDS dimensionality reduction method, and visualized by scatterplot, different colors and symbols are used to represent the groups to show the differences between samples more clearly (Fig. 7). The stress value of the NMDS analysis was below 0.2, confirming the reliability of the ordination results. The closer the distance between the samples, the smaller the difference between the fish communities in the two samples. In April, the fish composition of station SE02 and station SE14 were similar, station SE05, SE06 and SE07 were also similar. Fish composition at station SE16 was different from that at other stations (Fig. 7a).
NMDS Ordination Based on Bray–Curtis Dissimilarity of eDNA Composition (a) April survey sample. (b) September survey sample. (c) Comparison of samples in two-season. Each point in the figure represents a sample, with different colored points indicating different samples (groups). The proximity (or distance) between two points reflects the degree of similarity (or dissimilarity) in microbial community composition between the corresponding samples.
In September surveys, there was little difference in fish composition from station UE01 to station UE06, while they were different from other stations (Fig. 7b). Overall, the NMDS analysis of fish composition retrieved in different samples revealed marked spatial variation in community composition. In addition, we compared fish community composition between two-season, April and September, the results revealed clear clustering of samples by season, indicating significant differences in fish composition between the two periods (Fig. 7c).

